In an earlier article I described how Commercial EPCs ratings have changed dramatically due to changes made in June 2022, to reflect the increased contribution of renewables to the UK’s electricity network.
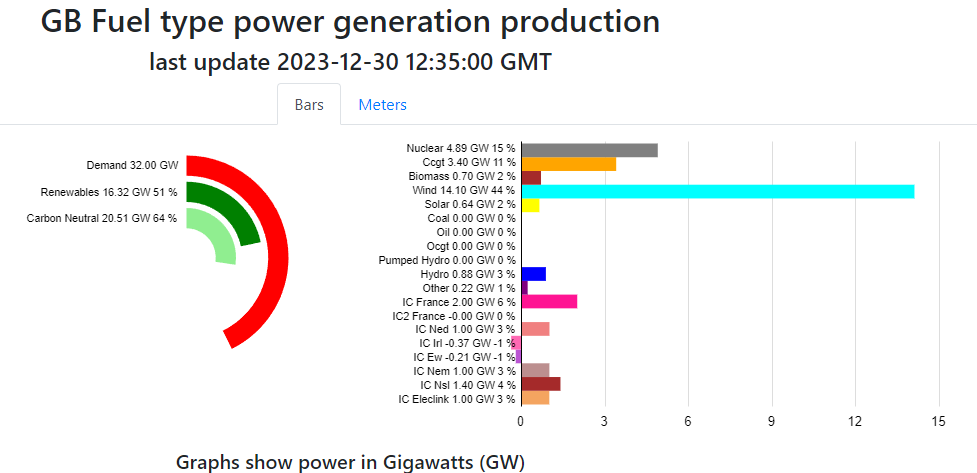
There’s a great site https://gridwatch.co.uk/ where electricity demand vs generation can be viewed, and the below graph for 30 December 2023 really illustrates the amount of energy that wind turbines can produce:

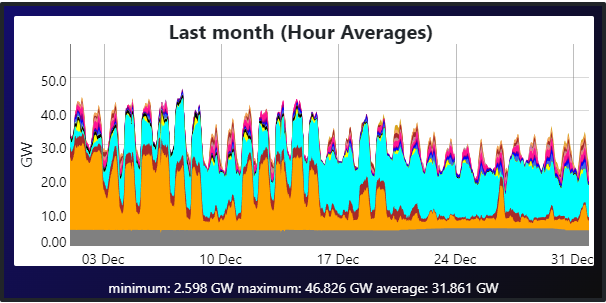
The above graph is for a windy day, but the graph for the month of December (below) shows Closed cycle gas turbines (orange) and Wind (turquoise) as being the main generators for the entire month.

The above also demonstrates the current weakness of renewables: their intermittency. For this reason, the UK should be investing massively in energy storage, as well as more predictable sources of renewable energy, such as tidal turbines.
